


扫码关注公众号(yougis),回复任意内容,可获取2000年-2024年NDVI数据
摘要
本文详细介绍如何使用OpenLayers加载NDVI WCS时序服务,包括WCS服务调用参数说明、GeoTIFF数据解析、NDVI渲染方式(灰度/彩色)、Canvas渲染、像元值查询功能等完整开发流程,并提供完整的代码示例。
关键词
OpenLayers、WCS、NDVI、GeoTIFF、Canvas、WebGIS、时序数据、JavaScript
一、项目概述
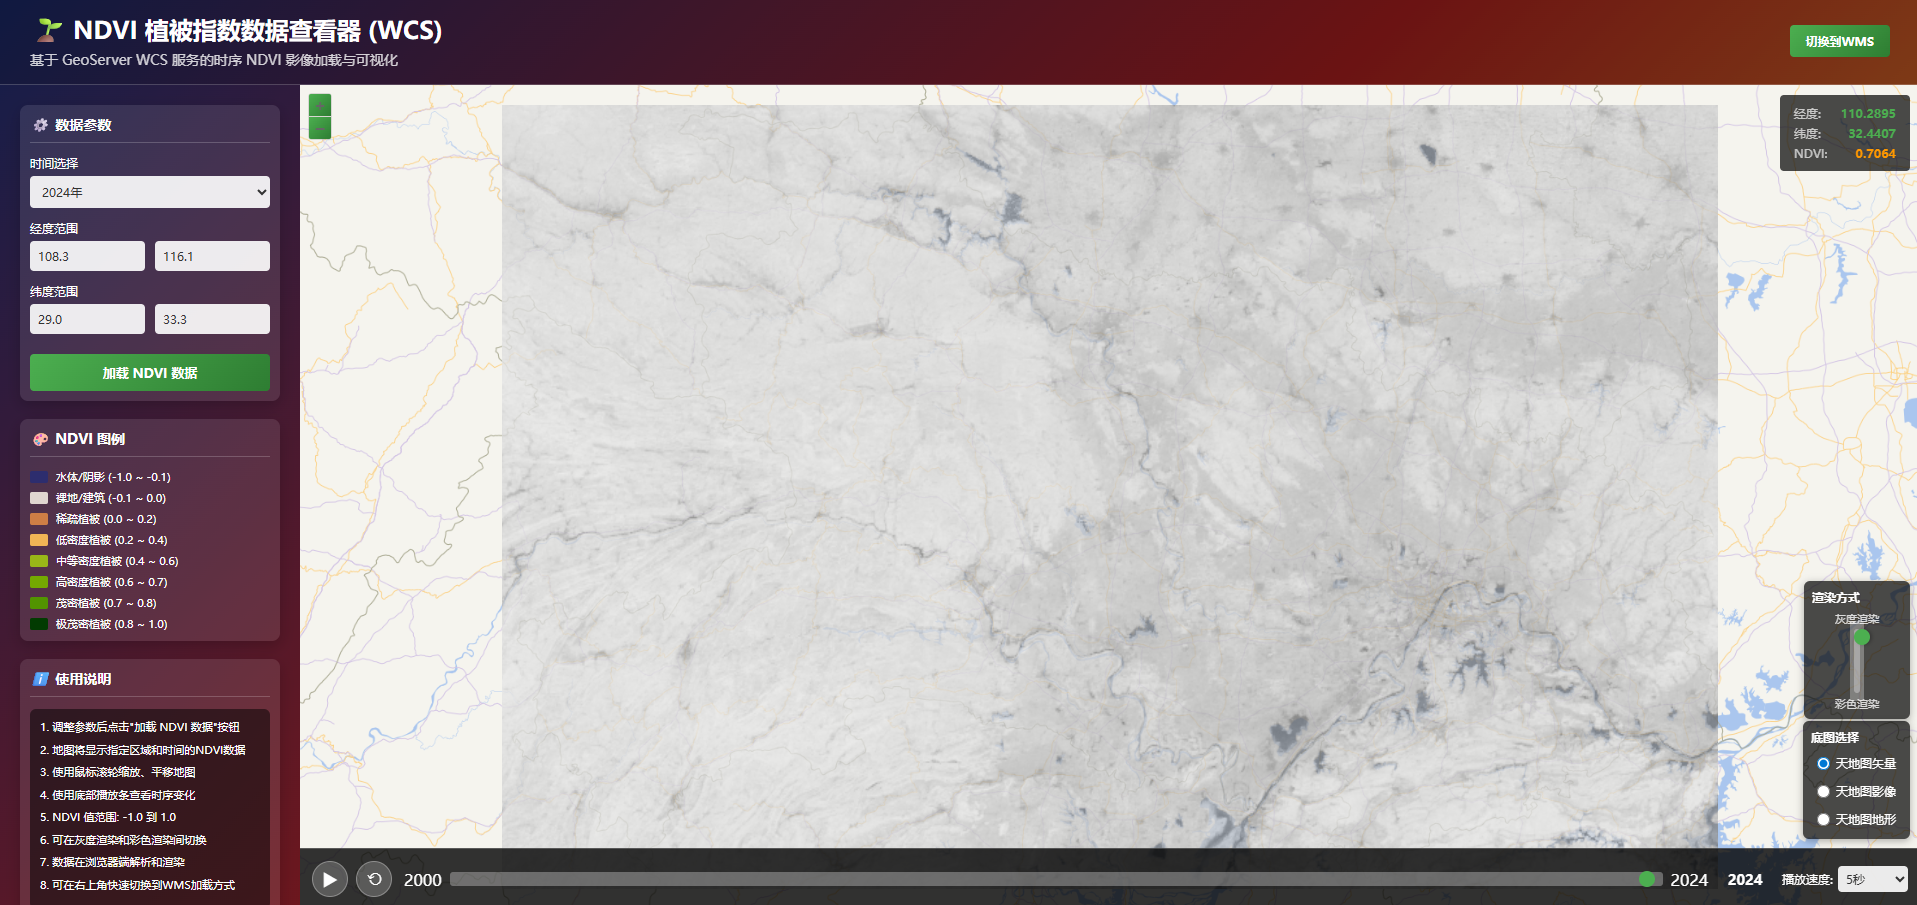
本文基于ndvi-wcs.html实现进行讲解,该应用是一个完整的NDVI时序数据WebGIS查看器,具有以下功能:
加载和显示NDVI WCS时序服务
时间滑块浏览不同年份的NDVI数据
自动播放功能,动态展示时序变化
鼠标移动时显示坐标和NDVI像元值
渲染方式切换(灰度渲染/彩色渲染)
底图切换功能(天地图矢量/影像/地形)
参数配置功能(经纬度范围、时间选择)
二、WCS服务调用参数
2.1 WCS GetCoverage参数
WCS服务的GetCoverage请求用于获取原始栅格数据,主要参数包括:
service:服务类型,固定为"WCS"
version:WCS版本,通常为"2.0.1"
request:请求类型,固定为"GetCoverage"
coverageId:数据集名称,如"sz:ndvi_mean"
format:数据格式,如"GeoTIFF"
subset:空间和时间范围,可指定多次
2.2 subset参数说明
subset参数用于指定数据的空间和时间范围:
subset=Long(108.3,116.1)
subset=Lat(29.0,33.3)
subset=Time("2024-01-01T00:00:00.000Z")
Long(min,max):经度范围
Lat(min,max):纬度范围
Time(“value”):时间值,ISO 8601格式
2.3 完整WCS URL示例
http://localhost:8080/geoserver/sz/wcs?
    service=WCS&
    version=2.0.1&
    request=GetCoverage&
    coverageId=ndvi_mean&
    format=GeoTIFF&
    subset=Long(108.3,116.1)&
    subset=Lat(29.0,33.3)&
    subset=Time("2024-01-01T00:00:00.000Z")
三、GeoTIFF数据解析
3.1 使用GeoTIFF.js库
GeoTIFF.js是一个JavaScript库,用于在浏览器中解析GeoTIFF文件。首先需要引入库:
<script src="https://cdn.jsdelivr.net/npm/geotiff@2.1.3/dist-browser/geotiff.js"></script>
3.2 解析GeoTIFF数据
获取WCS返回的ArrayBuffer后,使用GeoTIFF.js解析:
// 1. 获取 GeoTIFF 数据
const response = await fetch(wcsUrl);
const arrayBuffer = await response.arrayBuffer();

// 2. 使用 GeoTIFF.js 解析
const tiff = await GeoTIFF.fromArrayBuffer(arrayBuffer);
const image = await tiff.getImage();

// 3. 读取栅格数据
const rasters = await image.readRasters();
const bandData = rasters[0]; // NDVI通常只有一个波段
const width = image.getWidth();
const height = image.getHeight();
提示:NDVI数据通常是单波段的,所以rasters[0]就是NDVI值数组。
四、NDVI渲染方式
4.1 灰度渲染
灰度渲染将NDVI值线性映射到灰度值,用于查看原始数据分布:
// 将 NDVI 从 [-1, 1] 线性映射到灰度 [0, 255]
for (let i = 0; i < bandData.length; i++) {
    const ndviValue = bandData[i];
    const intensity = Math.round((ndviValue + 1) * 127.5);

    imageData.data[i * 4 + 0] = intensity; // R
    imageData.data[i * 4 + 1] = intensity; // G
    imageData.data[i * 4 + 2] = intensity; // B
    imageData.data[i * 4 + 3] = 255; // A (不透明)
}
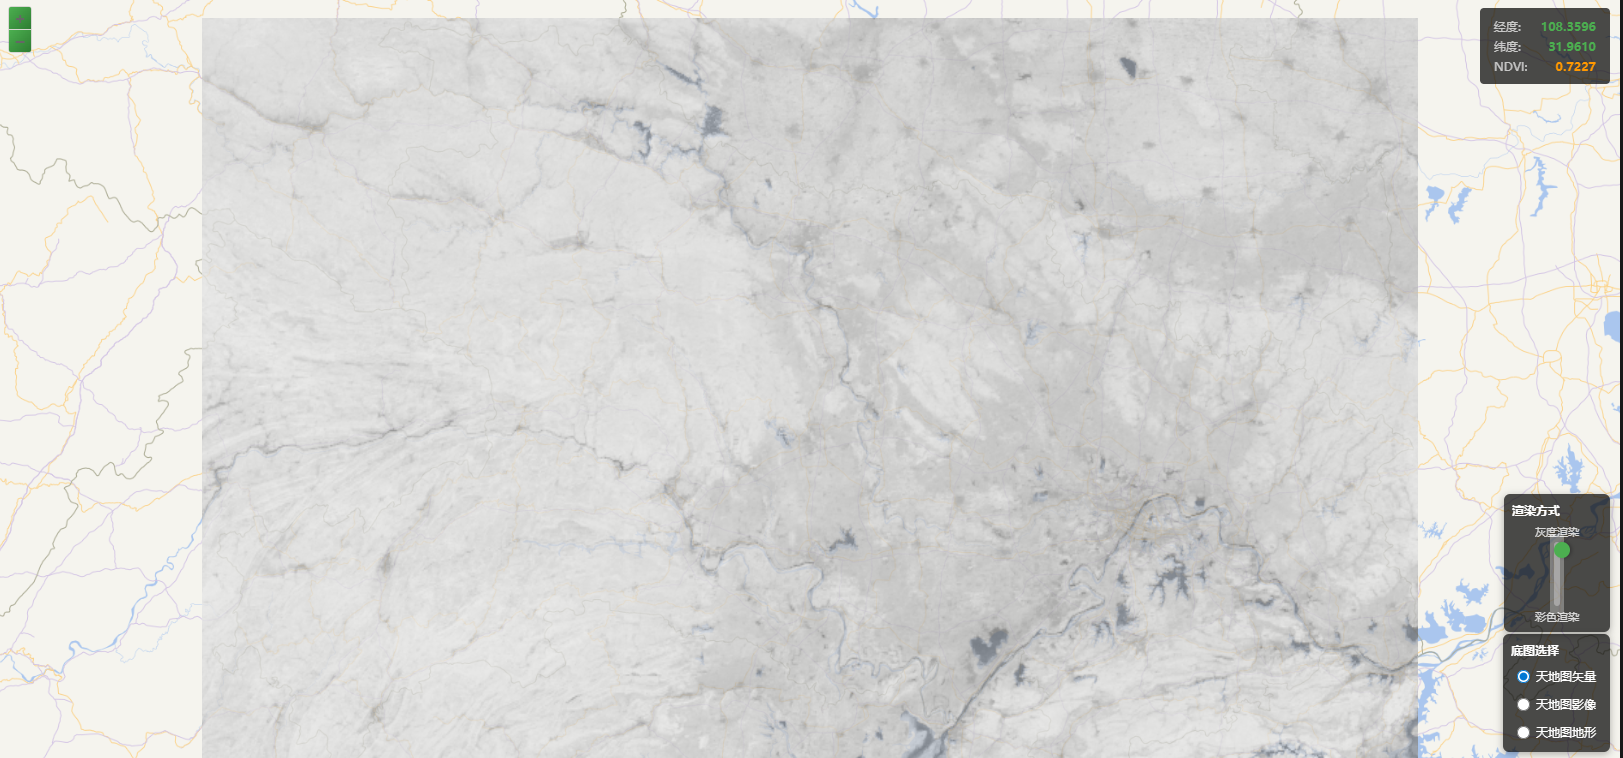
NDVI灰度渲染效果
4.2 彩色渲染
彩色渲染根据NDVI值映射到不同的颜色,便于直观理解植被分布:
function getNDVIColor(ndviValue) {
    if (isNaN(ndviValue) || ndviValue < -1 || ndviValue > 1) {
        return [0, 0, 0, 0]; // 透明
    }

    // 根据 NDVI 值返回对应的颜色
    if (ndviValue < -0.1) {
        return [45, 45, 110, 255]; // 水体/阴影
    } else if (ndviValue < 0.0) {
        return [224, 214, 208, 255]; // 裸地/建筑
    } else if (ndviValue < 0.2) {
        return [206, 126, 69, 255]; // 稀疏植被
    } else if (ndviValue < 0.4) {
        return [241, 181, 85, 255]; // 低密度植被
    } else if (ndviValue < 0.6) {
        return [153, 183, 24, 255]; // 中等密度植被
    } else if (ndviValue < 0.7) {
        return [116, 169, 1, 255]; // 高密度植被
    } else if (ndviValue < 0.8) {
        return [82, 148, 0, 255]; // 茂密植被
    } else {
        return [2, 59, 1, 255]; // 极茂密植被
    }
}

// 应用颜色映射
for (let i = 0; i < bandData.length; i++) {
    const ndviValue = bandData[i];
    const color = getNDVIColor(ndviValue);

    imageData.data[i * 4 + 0] = color[0]; // R
    imageData.data[i * 4 + 1] = color[1]; // G
    imageData.data[i * 4 + 2] = color[2]; // B
    imageData.data[i * 4 + 3] = color[3]; // A
}
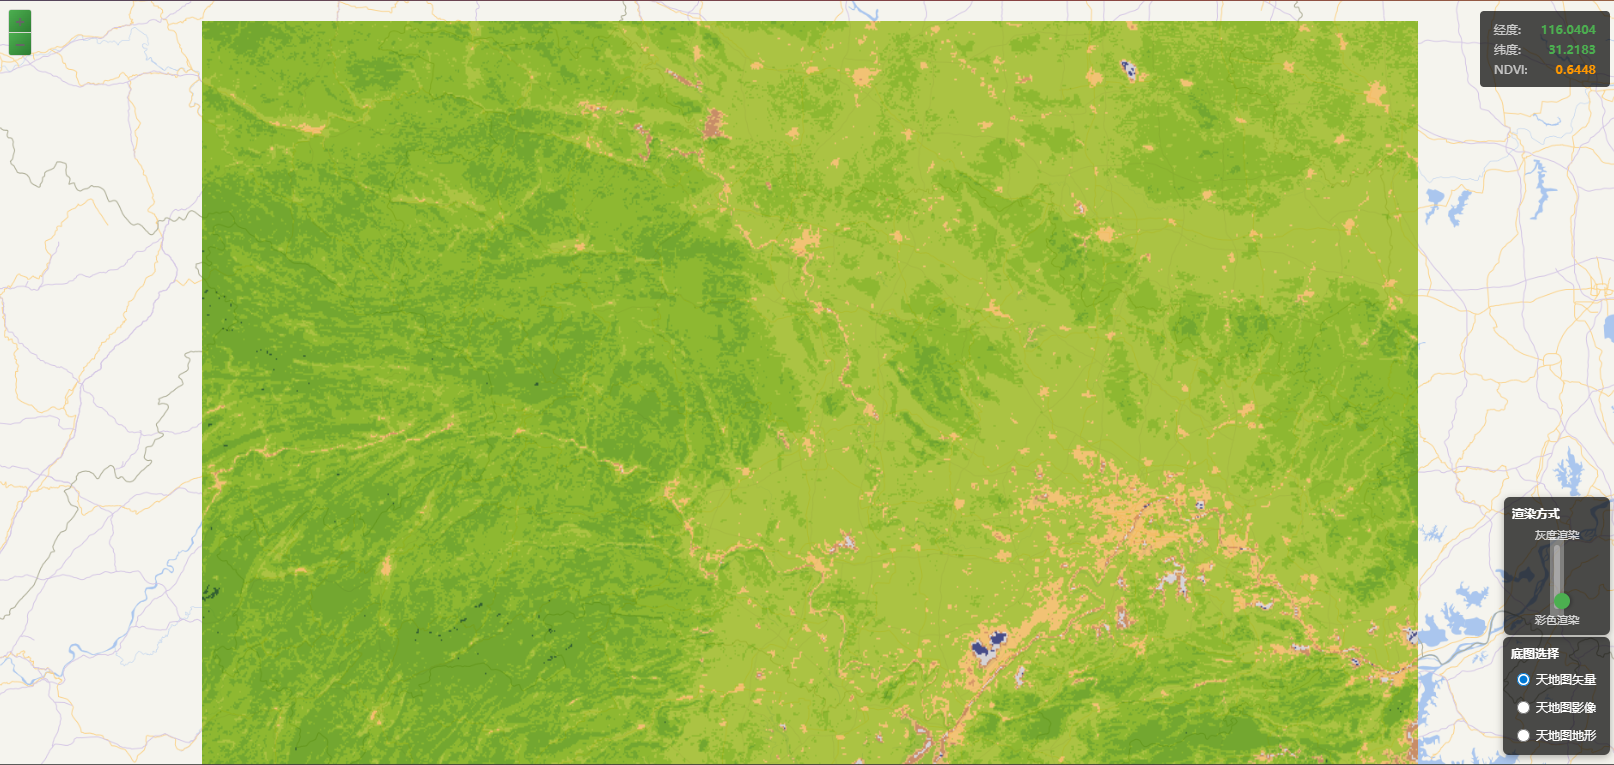
NDVI彩色渲染效果
4.3 Canvas渲染
使用Canvas API将渲染后的像素数据绘制到图像:
// 创建 Canvas
const canvas = document.createElement('canvas');
canvas.width = width;
canvas.height = height;
const ctx = canvas.getContext('2d');
const imageData = ctx.createImageData(width, height);

// 填充像素数据(根据渲染方式)
// ... 像素数据填充代码 ...

// 绘制到 Canvas
ctx.putImageData(imageData, 0, 0);

// 转换为 Data URL
const dataUrl = canvas.toDataURL('image/png');
五、OpenLayers加载WCS服务
5.1 创建ImageStatic图层
使用OpenLayers的ol.layer.Image和ol.source.ImageStatic创建WCS图层:
const ndviLayer = new ol.layer.Image({
    source: new ol.source.ImageStatic({
        url: dataUrl, // Canvas.toDataURL()的结果
        imageExtent: currentImageExtent, // 数据范围
        projection: 'EPSG:3857'
    }),
    opacity: 0.8
});
5.2 添加图层到地图
创建WCS图层后,使用map.addLayer()方法添加到地图:
map.addLayer(ndviLayer);
5.3 计算数据范围
需要将经纬度范围转换为Web Mercator投影(EPSG:3857):
const currentBBox = [longMin, latMin, longMax, latMax];
const currentImageExtent = ol.proj.transformExtent(currentBBox, 'EPSG:4326', 'EPSG:3857');
[图片位置:wcs_layer_diagram.png]
OpenLayers WCS图层结构示意图
六、像元值查询功能
6.1 坐标转换
将地图坐标转换为图像像素坐标:
function getNDVIValueAtCoordinate(coordinate) {
    if (!currentNDVIData || !currentBBox || !currentImageExtent) {
        return null;
    }

    // 将地图坐标转换为图像像素坐标
    const x = (coordinate[0] - currentImageExtent[0]) /
              (currentImageExtent[2] - currentImageExtent[0]) * currentNDVIData.width;
    const y = (currentImageExtent[3] - coordinate[1]) /
              (currentImageExtent[3] - currentImageExtent[1]) * currentNDVIData.height;

    const pixelX = Math.floor(x);
    const pixelY = Math.floor(y);

    // 检查像素坐标是否在图像范围内
    if (pixelX >= 0 && pixelX < currentNDVIData.width &&
        pixelY >= 0 && pixelY < currentNDVIData.height) {
        const index = pixelY * currentNDVIData.width + pixelX;
        return currentNDVIData.data[index];
    }

    return null;
}
6.2 监听鼠标移动事件
使用map.on('pointermove', ...)监听鼠标移动事件:
map.on('pointermove', function(evt) {
    const coordinate = ol.proj.toLonLat(evt.coordinate);
    document.getElementById('lonValue').textContent = coordinate[0].toFixed(4);
    document.getElementById('latValue').textContent = coordinate[1].toFixed(4);

    // 获取 NDVI 像元值(使用防抖)
    debouncedGetNDVIValue(evt.coordinate);
});
6.3 保存NDVI数据
需要保存解析后的NDVI数据用于像元值查询:
currentNDVIData = {
    data: bandData,
    width: width,
    height: height
};
提示:使用防抖函数(debounce)避免频繁计算,提升用户体验。
function debounce(func, wait) {
    let timeout;
    return function executedFunction(...args) {
        const later = () => {
            clearTimeout(timeout);
            func(...args);
        };
        clearTimeout(timeout);
        timeout = setTimeout(later, wait);
    };
}

const debouncedGetNDVIValue = debounce(function(coordinate) {
    const ndviValueElement = document.getElementById('ndviValue');
    const ndviValue = getNDVIValueAtCoordinate(coordinate);

    if (ndviValue !== null && !isNaN(ndviValue)) {
        ndviValueElement.textContent = ndviValue.toFixed(4);
    } else {
        ndviValueElement.textContent = '无数据';
    }
}, 100);
七、渲染方式切换
7.1 滑块控件
使用垂直滑块切换渲染方式:
<div class="render-slider-container">
    <span class="render-slider-label">灰度渲染</span>
    <div class="render-slider-wrapper">
        <input type="range" id="renderSlider"
               class="render-slider" min="0" max="1" step="1" value="1">
    </div>
    <span class="render-slider-label">彩色渲染</span>
</div>
7.2 滑块事件监听
监听滑块变化,重新渲染数据:
document.getElementById('renderSlider').addEventListener('input', function(e) {
    const sliderValue = parseInt(e.target.value);
    renderMode = sliderValue;

    // 重新加载当前数据以应用新的渲染方式
    if (currentYear) {
        loadNDVIData(currentYear);
    }
});
7.3 渲染模式逻辑
// 根据渲染方式选择不同的渲染方法
if (renderMode === 0) {
    // 应用 NDVI 颜色映射(彩色渲染)
    for (let i = 0; i < bandData.length; i++) {
        const ndviValue = bandData[i];
        const color = getNDVIColor(ndviValue);

        imageData.data[i * 4 + 0] = color[0]; // R
        imageData.data[i * 4 + 1] = color[1]; // G
        imageData.data[i * 4 + 2] = color[2]; // B
        imageData.data[i * 4 + 3] = color[3]; // A
    }
} else {
    // 原始影像:将 NDVI 值线性映射到灰度
    for (let i = 0; i < bandData.length; i++) {
        const ndviValue = bandData[i];

        // 将 NDVI 从 [-1, 1] 线性映射到灰度 [0, 255]
        const intensity = Math.round((ndviValue + 1) * 127.5);

        imageData.data[i * 4 + 0] = intensity; // R
        imageData.data[i * 4 + 1] = intensity; // G
        imageData.data[i * 4 + 2] = intensity; // B
        imageData.data[i * 4 + 3] = 255; // A (不透明)
    }
}
八、WCS与WMS对比
WCS和WMS是两种不同的OGC服务标准,各有其适用场景:
九、性能优化
9.1 数据加载优化
使用异步加载(async/await)
添加加载提示
使用Canvas.toDataURL()生成图像
设置适当的图层透明度
9.2 像元值查询优化
使用防抖函数减少查询频率
避免在数据加载时查询
缓存NDVI数据避免重复计算
9.3 内存管理
及时释放不再使用的Canvas对象
避免同时加载过多时间切片
使用适当的数据类型(Float32Array)
十、总结
本文详细介绍了使用OpenLayers加载NDVI WCS时序服务的完整开发流程,包括:
WCS服务调用参数说明
GeoTIFF.js数据解析
NDVI渲染方式(灰度/彩色)
Canvas渲染技术
OpenLayers ImageStatic图层创建
像元值查询功能实现
渲染方式切换功能
WCS与WMS的区别和应用场景选择
通过本文的学习,读者可以掌握使用OpenLayers加载WCS时序服务的完整技能,以及WCS与WMS的区别和应用场景选择。
评论区