


扫码关注公众号(yougis),回复任意内容,可获取2000年-2024年NDVI数据
摘要
本文详细介绍如何使用OpenLayers加载NDVI WMS时序服务,包括WMS服务调用参数说明、GetFeatureInfo像元值查询功能实现、时间滑块播放功能、底图切换功能等完整开发流程,并提供完整的代码示例。
关键词
OpenLayers、WMS、NDVI、GetFeatureInfo、WebGIS、时序数据、JavaScript
一、项目概述
本文基于ndvi-wms.html实现进行讲解,该应用是一个完整的NDVI时序数据WebGIS查看器,具有以下功能:
加载和显示NDVI WMS时序服务
时间滑块浏览不同年份的NDVI数据
自动播放功能,动态展示时序变化
鼠标移动时显示坐标和NDVI像元值
底图切换功能(天地图矢量/影像/地形)
参数配置功能(经纬度范围、时间选择)
[图片位置:ndvi_wms_overview.png]
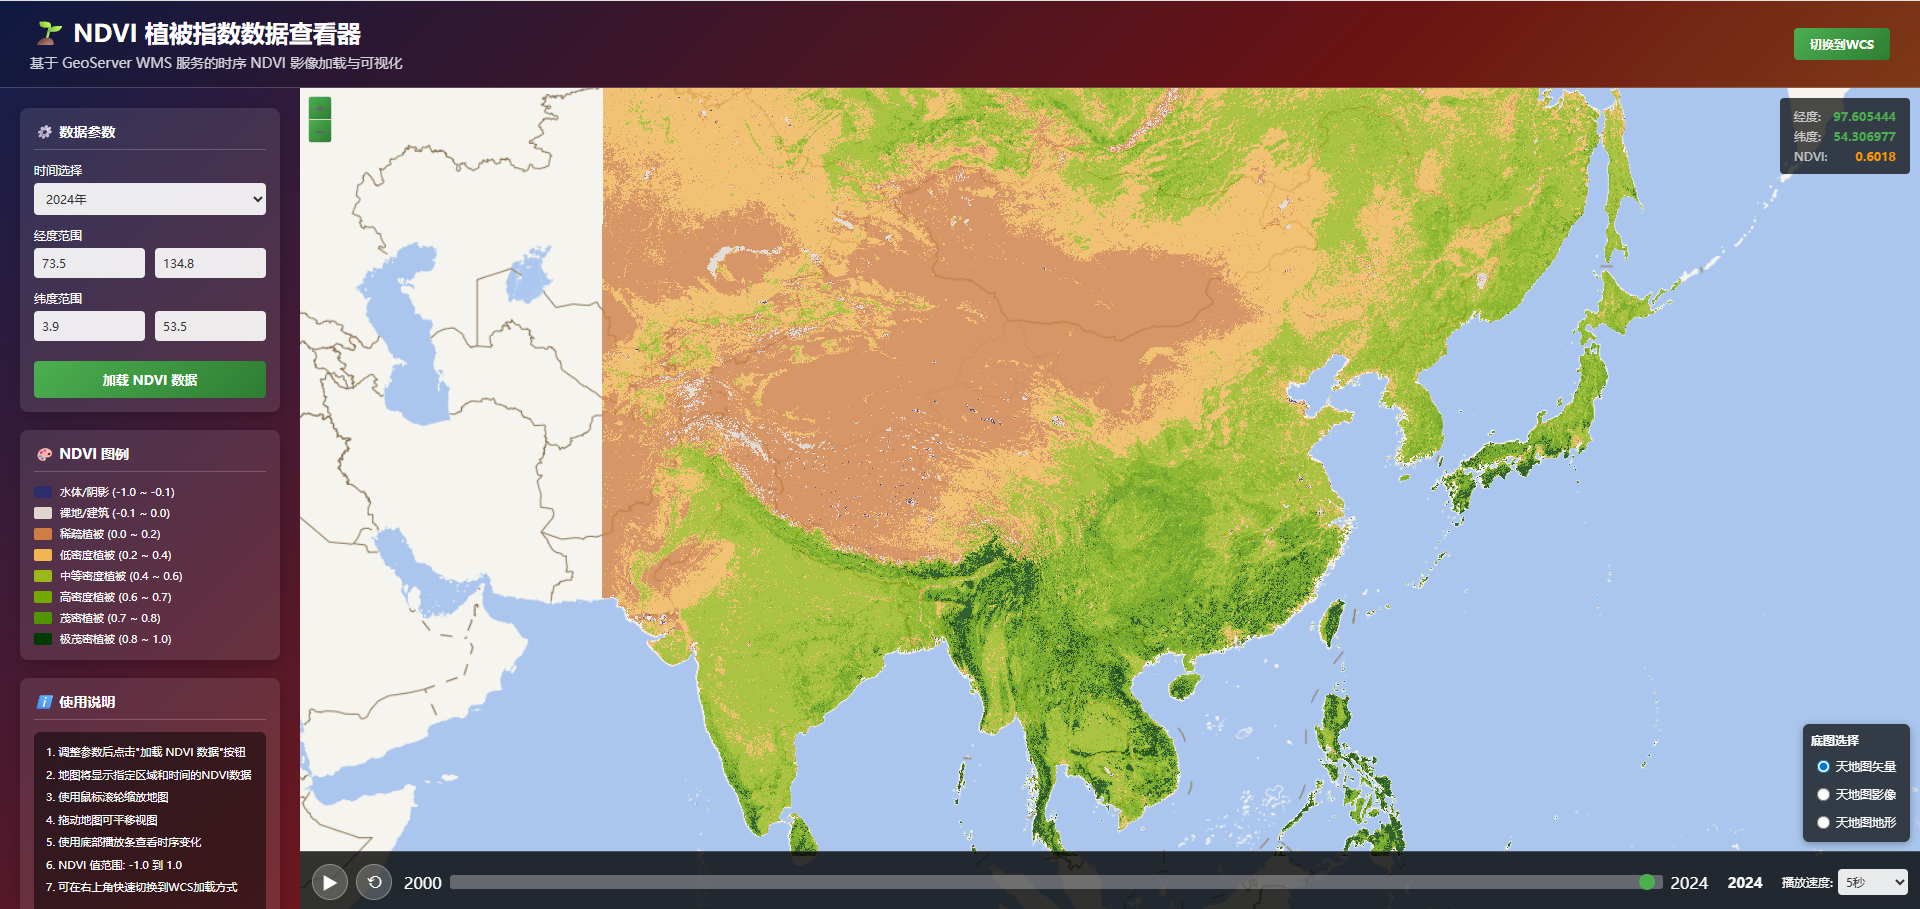
NDVI WMS时序服务应用界面
二、HTML页面结构
2.1 页面布局
页面采用响应式布局,包含以下主要区域:
Header:页面标题和副标题
Sidebar:左侧参数配置面板
Map Container:地图显示区域
Coordinates:坐标和NDVI值显示
Basemap Switcher:底图选择器
Timeline:时间播放控制条
2.2 核心HTML元素
<!-- 地图容器 -->
<div id="map"></div>

<!-- 坐标显示 -->
<div class="coordinates" id="coordinates">
    <div class="coord-row">
        <span class="coord-label">经度:</span>
        <span class="coord-value" id="lonValue">-</span>
    </div>
    <div class="coord-row">
        <span class="coord-label">纬度:</span>
        <span class="coord-value" id="latValue">-</span>
    </div>
    <div class="coord-row">
        <span class="coord-label">NDVI:</span>
        <span class="coord-value ndvi-value" id="ndviValue">-</span>
    </div>
</div>

<!-- 时间滑块 -->
<input type="range" id="yearSlider" min="2000" max="2024" value="2024" step="1">
三、WMS服务调用参数
3.1 WMS GetMap参数
WMS服务的GetMap请求用于获取地图图像,主要参数包括:
service:服务类型,固定为"WMS"
version:WMS版本,通常为"1.3.0"
request:请求类型,固定为"GetMap"
layers:图层名称,如"sz:ndvi_mean"
styles:样式名称,如"ndvi_ramp_v2"
time:时间参数,如"2024-01-01T00:00:00.000Z"
bbox:边界框,格式为"minx,miny,maxx,maxy"
width:图像宽度(像素)
height:图像高度(像素)
crs:坐标参考系统,如"EPSG:3857"
format:图像格式,如"image/png"
transparent:是否透明,通常为"true"
3.2 WMS GetFeatureInfo参数
WMS服务的GetFeatureInfo请求用于查询像元值,主要参数包括:
service:服务类型,固定为"WMS"
version:WMS版本,通常为"1.3.0"
request:请求类型,固定为"GetFeatureInfo"
layers:图层名称,如"sz:ndvi_mean"
query_layers:查询图层名称,与layers相同
info_format:返回格式,如"application/json"
feature_count:返回要素数量,通常为"1"
I:像素X坐标(WMS 1.3.0)
J:像素Y坐标(WMS 1.3.0)
bbox:边界框
crs:坐标参考系统
width:图像宽度
height:图像高度
time:时间参数(可选)
提示:WMS 1.3.0版本的I和J参数与WMS 1.1.0版本的X和Y参数不同,需要注意版本差异。
四、OpenLayers加载WMS服务
4.1 创建ImageWMS图层
使用OpenLayers的ol.layer.Image和ol.source.ImageWMS创建WMS图层:
const ndviLayer = new ol.layer.Image({
    source: new ol.source.ImageWMS({
        url: 'http://localhost:8080/geoserver/sz/wms',
        params: {
            'LAYERS': 'sz:ndvi_mean',
            'STYLES': 'ndvi_ramp_v2',
            'TIME': '2024-01-01T00:00:00.000Z',
            'FORMAT': 'image/png',
            'TRANSPARENT': true
        },
        ratio: 1,
        serverType: 'geoserver'
    }),
    opacity: 0.8
});
4.2 添加图层到地图
创建WMS图层后,使用map.addLayer()方法添加到地图:
map.addLayer(ndviLayer);
4.3 更新WMS图层
当时间或其他参数变化时,需要更新WMS图层:
// 移除旧图层
if (ndviLayer) {
    map.removeLayer(ndviLayer);
}

// 创建新图层
ndviLayer = new ol.layer.Image({
    source: new ol.source.ImageWMS({
        url: wmsUrl,
        params: {
            'LAYERS': 'sz:ndvi_mean',
            'STYLES': 'ndvi_ramp_v2',
            'TIME': time,
            'FORMAT': 'image/png',
            'TRANSPARENT': true
        },
        ratio: 1,
        serverType: 'geoserver'
    }),
    opacity: 0.8
});

// 添加到地图
map.addLayer(ndviLayer);
五、像元值查询功能
5.1 监听鼠标移动事件
使用map.on('pointermove', ...)监听鼠标移动事件:
map.on('pointermove', function(evt) {
    const coordinate = ol.proj.toLonLat(evt.coordinate);
    document.getElementById('lonValue').textContent = coordinate[0].toFixed(6);
    document.getElementById('latValue').textContent = coordinate[1].toFixed(6);

    // 获取 NDVI 像元值(使用防抖)
    debouncedGetNDVIValue(evt.coordinate);
});
5.2 构建GetFeatureInfo URL
手动构建GetFeatureInfo请求URL:
const view = map.getView();
const mapSize = map.getSize();
const bbox = view.calculateExtent();

const getFeatureInfoParams = {
    'SERVICE': 'WMS',
    'VERSION': '1.3.0',
    'REQUEST': 'GetFeatureInfo',
    'LAYERS': 'sz:ndvi_mean',
    'QUERY_LAYERS': 'sz:ndvi_mean',
    'INFO_FORMAT': 'application/json',
    'FEATURE_COUNT': 1,
    'I': Math.round((coordinate[0] - bbox[0]) / (bbox[2] - bbox[0]) * mapSize[0]),
    'J': Math.round((bbox[3] - coordinate[1]) / (bbox[3] - bbox[1]) * mapSize[1]),
    'BBOX': bbox.join(','),
    'CRS': projection.getCode(),
    'WIDTH': mapSize[0],
    'HEIGHT': mapSize[1]
};

// 如果有时间参数,添加到请求中
if (params.TIME) {
    getFeatureInfoParams.TIME = params.TIME;
}

const url = wmsUrl + '?' + Object.keys(getFeatureInfoParams)
    .map(key => key + '=' + encodeURIComponent(getFeatureInfoParams[key]))
    .join('&');
5.3 处理返回结果
解析GetFeatureInfo返回的JSON数据,提取NDVI值:
fetch(url)
    .then(response => response.json())
    .then(data => {
        if (data.features && data.features.length > 0) {
            const feature = data.features[0];
            const properties = feature.properties;

            // GeoServer 返回的栅格数据通常在 properties 中的某个字段
            // 常见字段名: GRAY_INDEX, gray_index, value, band1 等
            const ndviValue = properties.GRAY_INDEX !== undefined ?
                properties.GRAY_INDEX :
                (properties.gray_index !== undefined ? properties.gray_index :
                (properties.value !== undefined ? properties.value :
                (properties.band1 !== undefined ? properties.band1 : null)));

            if (ndviValue !== null) {
                document.getElementById('ndviValue').textContent = ndviValue.toFixed(4);
            } else {
                document.getElementById('ndviValue').textContent = '无数据';
            }
        }
    });
提示:使用防抖函数(debounce)避免频繁请求,提升用户体验。
function debounce(func, wait) {
    let timeout;
    return function executedFunction(...args) {
        const later = () => {
            clearTimeout(timeout);
            func(...args);
        };
        clearTimeout(timeout);
        timeout = setTimeout(later, wait);
    };
}

const debouncedGetNDVIValue = debounce(getNDVIValue, 300);
六、时间播放功能
6.1 时间滑块
使用HTML range input创建时间滑块:
<input type="range" id="yearSlider" min="2000" max="2024" value="2024" step="1">
6.2 播放/暂停功能
使用setInterval实现自动播放:
function togglePlay() {
    if (isPlaying) {
        // 暂停播放
        clearInterval(playInterval);
        isPlaying = false;
    } else {
        // 开始播放
        isPlaying = true;
        const speed = parseInt(document.getElementById('speedSelect').value);

        playInterval = setInterval(() => {
            currentYear++;
            if (currentYear > 2024) {
                currentYear = 2000;
            }
            updateYearDisplay(currentYear);
            loadNDVIData(currentYear);
        }, speed);
    }
}
6.3 更新年份显示
function updateYearDisplay(year) {
    document.getElementById('yearSlider').value = year;
    document.getElementById('yearDisplay').textContent = year;
    document.getElementById('timeSelect').value = year;
    currentYear = year;
}

时间播放控制条
七、底图切换功能
7.1 创建天地图图层
使用ol.layer.Tile和ol.source.XYZ创建天地图图层:
function createTiandituLayer(type) {
    const tk = 'your_tk'; // 天地图密钥
    let url;

    switch(type) {
        case 'tianditu_vec':
            url = `https://t{0-7}.tianditu.gov.cn/vec_w/wmts?SERVICE=WMTS&REQUEST=GetTile&VERSION=1.0.0&LAYER=vec&STYLE=default&TILEMATRIXSET=w&FORMAT=tiles&TILECOL={x}&TILEROW={y}&TILEMATRIX={z}&tk=${tk}`;
            break;
        case 'tianditu_img':
            url = `https://t{0-7}.tianditu.gov.cn/img_w/wmts?SERVICE=WMTS&REQUEST=GetTile&VERSION=1.0.0&LAYER=img&STYLE=default&TILEMATRIXSET=w&FORMAT=tiles&TILECOL={x}&TILEROW={y}&TILEMATRIX={z}&tk=${tk}`;
            break;
        case 'tianditu_ter':
            url = `https://t{0-7}.tianditu.gov.cn/ter_w/wmts?SERVICE=WMTS&REQUEST=GetTile&VERSION=1.0.0&LAYER=ter&STYLE=default&TILEMATRIXSET=w&FORMAT=tiles&TILECOL={x}&TILEROW={y}&TILEMATRIX={z}&tk=${tk}`;
            break;
    }

    return new ol.layer.Tile({
        source: new ol.source.XYZ({
            url: url,
            projection: 'EPSG:3857',
            tileSize: 256,
            wrapX: true,
            crossOrigin: 'anonymous'
        })
    });
}
7.2 切换底图
使用map.getLayers().insertAt()方法切换底图:
function switchBasemap(basemapType) {
    // 移除当前底图
    map.removeLayer(currentBasemapLayer);

    // 添加新底图
    map.getLayers().insertAt(0, newBasemapLayer);

    currentBasemap = basemapType;
}
八、总结
本文详细介绍了使用OpenLayers加载NDVI WMS时序服务的完整开发流程,包括:
WMS服务调用参数说明
OpenLayers ImageWMS图层创建
GetFeatureInfo像元值查询实现
时间播放功能开发
底图切换功能实现
通过本文的学习,读者可以掌握使用OpenLayers加载WMS时序服务的完整技能。
在下一篇文章中,我们将介绍如何使用OpenLayers加载NDVI WCS时序服务,以及WCS与WMS的区别和应用场景。
评论区